Saturday, February 28, 2015

Lions, Lambs and March Weather

There is the old saying that March comes in like a lion and goes out as a lamb.

In other words, March starts out cold and stormy, but by the end of the month the weather has warmed and moderated considerably.

But is that true here in the Northwest?   Is it true anywhere in the U.S.?    This critical question will be answered in this blog.


Since this blog is dedicated to a scientific approach in all matters, we will quantify this issue by devising a LionToLamb (LTL) index at locations around the U.S.  The LTL is the difference between the April and February temperatures at a weather observing site:

LTL= Average April Temperature - Average February Temperature

If April is much warmer than February, the weather is undergoing a substantial lion to lamb transition in March.

So let's examine the evidence.  Here are the LionToLamb numbers for major cities in the U.S. in degrees F.   You will note that very large LionToLamb transitions (greater than 20F) are limited to the Upper Plains and northern Midwest.   For these folks,  the approach of spring is a big deal.

Moderate LionToLamb numbers are evidence over the Northeast the northern portions of the SE U.S. and into the high Plains from Montana into northern Texas.

Where is the LionToLamb transition very weak, so that spring is only evinced by weak, gradual warming?  The answer: the Pacific coastal zone where the index ranges from 6.9F in Seattle to a measly 2.8F in Los Angeles.   Spring is much more noticeable east of the Cascade crest.

Spring is really not a dramatic season west of the Cascade crest as illustrated by a plot of climatological temperatures at Seattle Tacoma Airport (average highs and low shown by red and blue lines).

You can see the problem by looking at the climatological temperatures at about 3000 ft (925 hPa pressure)  for the nearest radiosonde sounding location  to Seattle (Quillayute on the Washington coast).  The black line shows the a average temperatures at this lower-atmospheric level.  No increase until roughly mid-April!  The red and blue lines are the record high and low temperatures at that site for those days.


Contrast this with the temperatures at the same level at Minneapolis (MPX).  Major warming in March.   Lions transform to lambs!


Why don't we have a major Lion to Lamb transition in March along the West Coast?    One major reason is the Pacific Ocean, which greatly moderates our temperatures year round.  Since we never get that cold, we don't get a major warm up when the sun revs up.   In essence, the Pacific acts as a big temperature flywheel.

But there is more.  In Spring, our flow generally transitions from southerly (originating over warmer water to our south) to westerly and northwesterly flow (from colder climes).   This slows down the warming considerably.  

Let me illustrate this.   Here are the average winds near the surface (1000 hPa) in February. Southerly flow over the coastal Northwest, but northwesterly low over the upper plains.
In April the winds over the eastern Pacific are more westerly (and thus passing over colder water), while southerly winds are pushing up into the Midwest.   

The bottom line:   the old saying about March weather goes from a lion to lamb is really not true in western Oregon and Washington, as well as coastal BC and California.   Perhaps we should say that in the Northwest "March comes in as a goat and goes out as a sheep."    Or perhaps  "in July, sun glasses must buy."   Or "in June, beware the gloom."  

I better stick to numerical weather prediction and let others deal with witty aphorisms.

Thursday, February 26, 2015

Strong Winds, Coal Dust, and the Proposed Gateway Pacific Coal Terminal

A major coal export terminal has been proposed at Cherry Point, on the Strait of Georgia northwest of Bellingham (see map).   Known as the Gateway Pacific Terminal (GPT), this proposed facility would offload large quantities of coal from rail cars into huge coal piles and then load the coal on to waiting ships.   We are talking about millions of tons of coal per year.
A major issue is whether winds will lift coal dust from this facility and then distribute the coal particles into the natural and human-occupied environment.  There is good reason for concern about this, with coal dust storms coming off the Canadian Westshore coal port when the wind picks up (see the image below).  The Westshore coal export facility is just north of the border (see figure) in a location that is far less windy than the proposed Cherry Point/GPT site (more on this later).

Coal dust blowing from the Westshore coal terminal, British Columbia, April 2012. Photo: Jerry Bierens, Delta Optimist.

The proposed GPT site will include large hills of coal delivered by 10-20 coal trains per day.  Will winds be sufficient to create coal dust storms as shown above?

To study the wind issue at the proposed Cherry Point site, UW undergraduate Ryan Clark and I  have examined the nearby wind observations, with support from a local non-profit organization (Research Now).   A summary of our findings can be accessed here, but I will summarize them in this blog.

 We looked at roughly five years of  6 minute or hourly wind data, mainly at two sites: the south pier near the BP Oil Refinery and a land site near the BP storage facility. The former site is maintained by NOAA's National Ocean Service and the later by the Northwest Clean Air Agency.  The proposed GPT coal pier is also shown on the map.


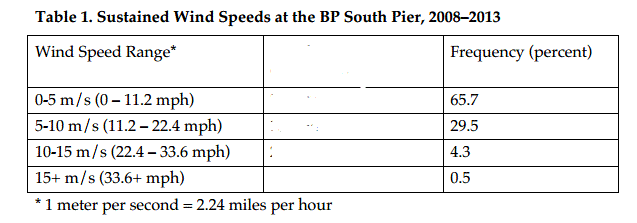
Strong winds are not unusual at the pier locations, something that is illustrated by the summary of the south pier wind speed data, shown below.  Keep in mind it takes winds of 20-30 mph to raise significant dust.  Winds that are probably strong enough to raise some dust occurred about 5 percent of the time, with winds certain to raise coal dust (33.6 mph and more) about .5% of the time (9 days over five years).

A nice way to summarize the winds at a location is something called a wind rose:  one for the south pier is shown below.  This plot shows the frequency of winds (in meters per second, multiple by roughly two to get knots) from various directions, with the shading indicating the frequency of various wind speeds.  The inner circle indicates 2% of the time, the middle circle 4% of the time, etc. The most frequent strong winds at this site are from the south-southeast, but there are also many strong winds from the northeast.   These are the winds blowing of the of the Fraser River valley, a major gap in the Cascades (see terrain map above).  A secondary peak is from the northwest.

The winds just inland at the BP land site (which should be similar to the proposed coal pile locations) is described by the wind rose below.  Quite a bit different; over land the winds are reduced (water is aerodynamically smooth compared to land surfaces) and the northeast winds coming out of the Fraser River Valley are much more prominent (perhaps 10-15% of the time).


A key issue for the proposed coal terminal site is that it is at ground zero for the northeasterly winds coming out of the Fraser River Valley--the positioning could not be worse.  And every few years there are extreme events, when the winds gust to 30-70 mph--which would play havoc with the coal piles.  For example, an event in December 1990 brought winds exceeding 30 meters per second (60 knots) over the proposed coal terminal.
 Want to see a video showing you what a strong SE blow in the Bellingham area can look like?  Click on the image or the link:


So strong winds will either blow the coal dust out into the Strait of Georgia, polluting the waters, or send the particles toward Vancouver (in SE winds) or towards Bellingham (NW winds) to influence the human population.   Blowing coal dust right over the prime habitat of the endangered southern resident killer whales, which are protected under both the Marine Mammal Protection Act and the Endangered Species Act.

And it is worse than that.   The proposed facility will use water sprayers (misters) to keep down the dust.  But the strong NE winds are virtually always accompanied by cold, below-freezing temperatures, which would freeze up the sprayers.

But there is more!  The incessant coal train traffic will tie up road traffic in the Puget Sound region as the trains block crossings in Seattle, Edmonds, and Everett (among other locations), with an substantial economic cost that will more than negate the few permanent jobs this project creates.   The coal ships and the trains coming and going will worsen regional air pollution, as will the combustion products produced in Asia when the coal is burnt--gases and particles that will waft their way across the Pacific back to us.

Heading our way

And the huge amount of coal burned as a result of this project will make a large contribution to global warming, outweighing everything done in our region to reduce our carbon footprint.

So how many ways can you spell environmental disaster?   And for what?   To help out Wyoming and Montana make some extra cash?  Increase the profits from some foreign coal companies?  We end up with profoundly negative impacts to our environment and economy and gain nothing in return.  Global warming is substantially worsened. Our roads get tied up and our air quality declines.

Stopping this irrational project should be the goal of a bipartisan coalition in our state since nearly  everyone will lose if it goes through.  Bad for business, bad for the environment, bad for traffic, bad for health.


Tuesday, February 24, 2015

The Winter Without SAD (Seasonal Affective Disorder)

Although there have been complaints about the lack of snowfall, there is a substantial silver lining to this winter: lots of sun.   Frequent, glorious sunshine even during the mid-winter months.  One of the sunniest winters in recent memory.


And my own observation is that folks in Seattle have been a lot more cheerful and happy this winter as a result. Normally, many people complain about midwinter blahs, often known by the imposing name of Seasonal Affective Disorder (SAD), with conversations edging towards comparing light boxes and mid-winter trips to sunnier climes.

But not this year.   People go on and on about the sun, about the high pressure, and whether this is some kind of climate-change omen.

So what has been going on?  Let's take a look at the solar radiation measurements of  this winter (Nov-January) compared to two years ago at the WSU Agweather site in Seattle.  The monthly amounts are in MegaJoules per unit meter squared (such terminology will impress your friends).  It is evident that we had a lot more solar radiation this year than two years ago.


Or consider the station in Woodinville, WA.  Let's looks at the solar radiation there last month and the previous January's in MJ/square meter

2015  113
2014  105
2013  101
2012  83
2011   79

More sun in 2015.  A lot more than 2011 and 2012.

This has been the winter of the big West Coast ridge, with extended periods of precipitation-free, sunny skies, interrupted by short periods of heavy rain.   The following plot of the precipitation observations at Seattle Tacoma Airport shows this clearly.  The blue line is the typical amounts and red line is the observed.  They show the CUMULATIVE amounts over the last 12 weeks. The horizontal plateaus indicate dry periods.
The question you are all asking:  will we have more sun?   Is there a pay back for our beautiful weather?  A cloudy yin for our sunny yang.

The answer will warm your heart.

First, the sun is getting much stronger now and the days far longer.  So even if clouds are around, there is more light.  It is rare to get major storms after roughly February 25th.  I mean big lowland snowstorms, windstorms, or floods.  Meteorological spring is here.

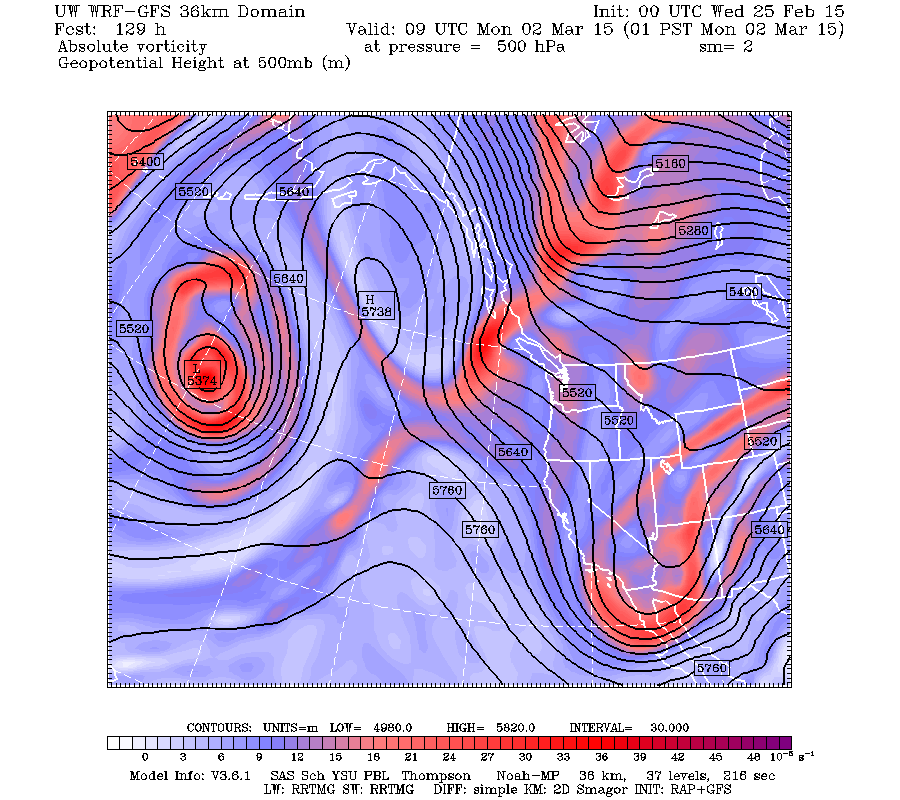
As I noted in an earlier blog, the ridge has not gone away, just shifted a bit westward.  The upper level map for 1 AM Monday illustrates this.  This ridge position allows weak disturbances (troughs) to pass southward through the Northwest.   But these troughs will only bring brief periods of clouds and precipitation (roughly a day) before sun comes out again.   In fact, this weekend looks sunny.


Finally, here is a high-tech ensemble-based prediction of cloud cover over Seattle from the North American Ensemble Forecasting System (NAEFS).  Cloud cover goes from 0 to 10 (completely cloudy) and the dates are on the bottom.  The horizontal black line shows the median (middle) value of the ensemble of forecasts.   We have a cloudy period coming on Thursday and Friday, followed by sun over the weekend.  Ups and downs, but we don't stay clouded in for long.


And one more measure of the warm, sunny nature of this winter.  I had to cut my lawn last weekend, something I have never done this early before.

Rider Oasis Questionnaire

A group of bicycle enthusiasts are developing the idea to place convenient kiosks around the city with items of interest to cyclists.  They have a questionnaire available on their website.  Please take a look and give them feedback if you have a minute...thanks.


The Pacific Northwest Weather Workshop
Interested in attending the big local weather workshop of the region?  The Pacific Northwest Weather Workshop will be held in Seattle at the NOAA facility on February 27-28th.   Everyone is invited and the majority of talks are accessible to laypeople.  To attend you have to register or they won't let you in the gate.  There will be a major session on the Oso landslide.  There is a registration fee that covers refreshments and food, and special student pricing.  If interested, check out this website.