Friday, January 31, 2014

Cold Weather and a CHANCE of Light Snow on Sunday Night

Saturday evening update: not much precipitation with the system tomorrow evening, so even the chances of some flurries is getting small near sea level.  So just cold air.  But a heads up...the latest runs have some snow on Saturday...but lets wait on getting too excited about that!
 
This week was a good one for snow in the Cascades and colder air will soon be visiting the Northwest.  And perhaps some of us in the lowlands may get a dusting of the white stuff Sunday night, before a week of cold and sun arrives.

First, the mountains snows this week.   We FINALLY enjoyed a weakening of the extraordinarily persistent ridge of high pressure along the west coast, with cool flow from the southwest providing 10-20 inches at many locations above 3000 ft in the Cascades (see 500 hPa weather map for 10 AM on Wednesday, the solid lines are the heights of that pressure surface, with winds parallel to the height lines).  Very different from the uber-ridge pattern of the past few weeks.


The impacts on snow at major Cascade ski areas were substantial.  Here are the snow depths at Snoqualmie Pass, Stevens Pass, and Mt. Hood.

Snoqualmie Pass
Stevens Pass
 Mt. Hood

Snoqualme Pass was a big winner, gaining 20 inches. Stevens got about 10 inches, Mt. Hood a bit less.

 Let's check on how well the overall snow pack is doing compared to normal (see figure below of the % of normal snow water equivalent).  Washington is below normal, but not dangerously so...roughly 70% in the North Cascades to about 50% near the southern border.   Oregon is not so lucky, running from about 40% in the north to 20% in the south.  Skiing has not started a Mt. Ashland and many other Oregon ski resorts.  California is a disaster area.   They have a big problem.


What about the future for us?  Think cold and dry.

Our old friend, the east Pacific ridge of high pressure will be coming back, but this time it will shift slightly west, allowing strong northerly flow and cooler air to invade the Northwest (see map)

Our temperatures will drop to below normal, with highs only in the lower 40s.  But this is generally a  dry pattern for us and one that should bring considerable sun during the week.

But we do have one shot of some very, very light snow in the lowlands.  Sunday evening a week upper level trough will move though and than might do two things:  bring in colder air and produce a few light showers...perhaps snow showers.  Don't worry...we aren't going to end up like Atlanta (where the National Weather Service DID forecast snow and poor human response caused unnecessary havoc).

To illustrate the change in conditions, here is the surface chart for 10 PM tonight (Friday).  The colors are temperatures at 925 hPa...about 2500 ft above the surface).  Yellows are the warmest, purples are very cold.

 Here is Tuesday at 1 PM.  See the difference?  Really cold air in southern BC, with eastern WA getting a piece of it.  Cooling west of the Cascades.  But if you look closely you will see that the winds are from the east...and that means dry conditions for us west of the Cascade crest.

Total snow fall during the next 72 h?  Pathetic totals, with perhaps 1-2 inches in the Cascades.  Better in the Rockies.  Little further relief for Washington and Oregon ski areas.

The West Coast ridge appears to be immortal this year...if only we had a meteorological silver stake to put it out of its misery.


Wednesday, January 29, 2014

Super Bowl Weather: Super Boring

 Friday AM Super Bowl Update:  Forecasts are trending warmer for Sunday, so it looks like the game will start in the lower 40s, with a trend down into the upper 30s during the event.  Looks completely dry during the game, with a modest (roughly 10 knot) wind from the west/northwest.  


After all the hype and worry about snow storms and blizzards.  Of freezing temperatures and strong winds.  After all the gnashing of teeth and media coverage, it appears that the fears were unfounded.

Super Bowl Snow Apocalypse Avoided.

The Super Bowl will have super boring weather.  Weather that will make the Seahawks feel right at home. 

We are now within 120 hr of the start of the game and this is a time horizon within which weather forecasting models are far more skillful than at more extended ranges.   Yes, there are some uncertainties, but it would be extremely unlikely for any major storm to appear in the forecasts as we get closer.

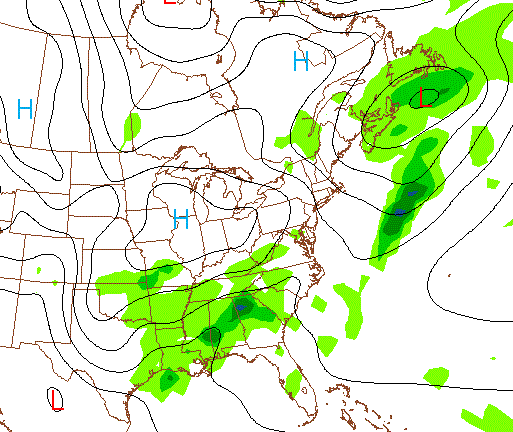
First, the big picture.  The sea level pressure and precipitation forecast for 7 PM Sunday is shown below.  High pressure is building over the region at that time with a low center (with some associated precipitation) off the coast.  Some light precip to the southeast.  The Super Bowl venue in East Rutherford, NJ looks good..no major action..  The skies will start the game cloudy, modest NW winds, and cooling temperatures.  A small chance 20-40% of some light showers.


How cool?  I have looked at all available guidance, from forecast model ensembles, to high resolution models plus statistical guidance of various types.  I will spare you most of the technical detail, but here is the  bottom line.

Sunday will probably see some precipitation early in the day, but that will be fading out in the afternoon.  The high temp at the SB site on Sunday will be in the upper 30s, but will be cooling to around freezing at the kick off (around 6:30 PM).  Temperatures will fall into the upper 20s during the game.   The northwest winds will be noticeable (around 10 mph), but not a game changer.

You want more details?   Here is the National Weather Service hour by hour forecasts that day for temperature (red line, top panel), wind (middle panel), and probability of precipitation (brown line, bottom panel).  Pretty much what I told you above.


Or take a peak at the US/Canada NAEFS ensemble product for New York City.  Temperature around freezing, modest winds, clearing pattern...the same thing.

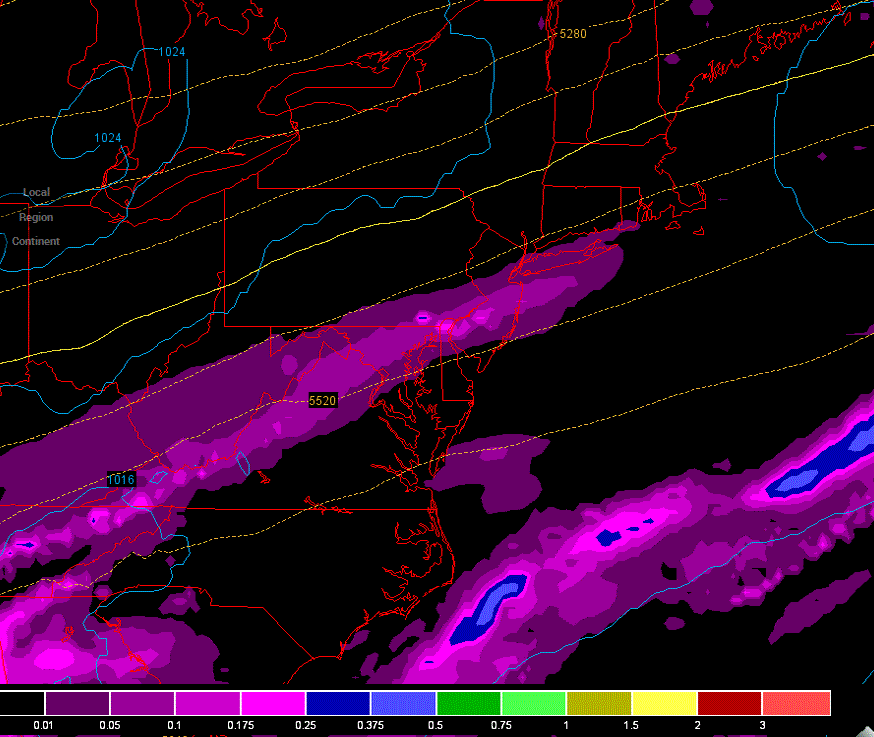
Or the uber-skillful European Model, which does suggest some light precipitation at the beginning of the game (map for 7 PM below) that would fade out quickly.
 The European Center temperatures?  A few degrees above freezing at the start of the game (temps are in C here)


Temperatures in the 30s, with clouds, and some light sprinkles--this sounds like Seattle winter conditions!  The Seahawks will feel very comfortable with the weather conditions at MetLife stadium on Sunday. 


Monday, January 27, 2014

2013 Versus 2014: The View from Space

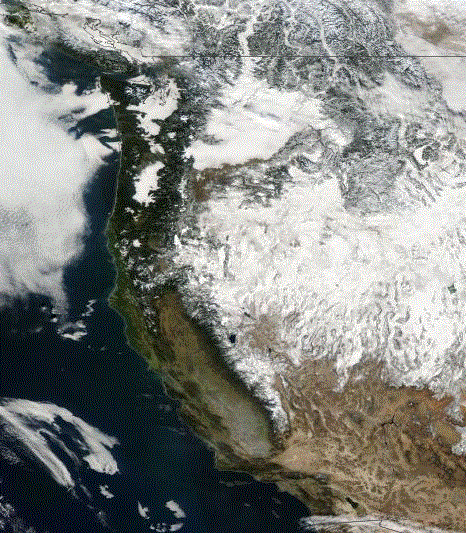
The snow pack over the western U.S. is dramatically less in mid-January 2014 than for the same time  in 2013.   The view from space is startling and scary.  I have selected two days when high pressure was overhead (January 20th, 2013 and 2014), so that clouds do not obscure the view.  The pictures are from the NASA MODIS Aqua satellite.

The picture on the top is from 2013.   Plenty of snow on the Sierra Nevada, and northern and central Nevada is covered by snow.  The Klamath Mountains/Siskiyou Mountains on the Oregon/CA border have snow.  Even the higher terrain in the Oregon coastal mountains have some white.  Life is good.


Now take a look at 2014.   Same date, one year later.  Wow..what a difference.  Sierra Nevada have very little. Virtually no snow in Nevada.  The mountains of northern CA/southern Oregon have nearly nothing. Not good.  One thing in common between the two years?  Low clouds in eastern Washington!


Let me impress you further.  Here is the came comparison (2013 top, 2014 bottom, but with close ups over California.  Pretty amazing reduction in 2014 of snow cover.


Let's really look close....in this case examining the region around Lake Tahoe.  What a huge difference, lots of white (snow) in 2013 (top), almost nothing in 2014 (bottom).


The lack of precipitation in the Sierra Nevada is so severe that the famous Yosemite Falls is virtually dry (see picture taken a few days ago), something that is very unusual in January (but not unusual during the late summer and early fall).


Want a small bit of good news?   Modest precipitation is returning to the western U.S.  Here are the precipitation totals for the next two 72 hr periods.  The fun starts early on Tuesday.  Cascades do the best, but the second period shows an area of heavy (2-5 inches) precipitation over the Sierra Nevada.  Those folks need precipitation...badly.


Saturday, January 25, 2014

Oregon's Fire Season Starts in January and 122 MPH in the Columbia Gorge!

Today brought two extraordinary meteorological events in Oregon:

First, the Oregon wildfire season began in JANUARY, with multiple fires around the state.

Second, winds today gusted up to at least 122 mph at the Vista House in the Columbia Gorge.

This is really unusual.

The National Weather Service has a Red Flag Warming out for the Cascades and Coastal Mountains of Oregon (see graphic).   With drought conditions for the past several months, very strong easterly winds, warm temperatures (reaching to 70F on the central Oregon coast) and rock-bottom relative humidities, western Oregon is ready to burn.  What is a Red Flag Warning?  Here is the official NWS definition:

A RED FLAG WARNING MEANS THAT CRITICAL FIRE WEATHER CONDITIONS
ARE EITHER OCCURRING NOW...OR WILL SHORTLY. A COMBINATION OF
STRONG WINDS...LOW RELATIVE HUMIDITY...AND WARM TEMPERATURES WILL
CREATE EXPLOSIVE FIRE GROWTH POTENTIAL.


And in fact there are now five active fires in the Cascades and three in the coastal mountains (see pictures if fires near Arch Cape).


Take a look at the maximum wind speed during the 24h ending 9 PM on Friday over NW Oregon, lots of gusts reaching 35-45 mph on the coast and the western side of the Gorge had winds hitting 40-100 mph.
:

High temperatures today were in the mid to upper 60s along the Oregon coast.


So combine extraordinary dry condition, warm temperatures and wind and what do you get?  A substantial wildfire danger, even in mid-winter.   And you want to hear about something really strange?  It has been so dry that trees, desperate for water, have been invading and clogging up sewer lines (see image).  A bonanza for plumbers.  This is getting to sound like some kind of horror movie.


Today the pressure difference across the Gorge got to 11 hPa (that is a LOT), with higher pressure in eastern WA.  Plus, there was a pool of shallow cold air over eastern Washington ready to move into the Gorge.  Ideal conditions for gap winds.  Today, the winds gusted to at least 122 mph in the parking lot of the Vista House, which overlooks the Gorge.   In fact, the winds were probably even higher since the unit could not read more than that speed.  On the other hand, it was measured by a hand-held anemometer through a sun roof and thus there was certainly some acceleration of flow around the car.  Here is their proof:


With strong winds over the western Gorge and parts of the Portland Metro area, thousands of folks have lost power around Portland and there has even been structural damage to some buildings (see picture)


But I have some major news.   The weather pattern looks like it will shift on Tuesday and precipitation will return to Oregon and Washington starting early Tuesday. Finally.   And this shift has implications for the Super Bowl on Sunday, Feb 2, as I will talk about in a future blog.

Thursday, January 23, 2014

Weather Insights for SuperBowl 2014

During the past few days, a few bookies and odd-setters have contacted me, asking my take on the weather associated with the Super Bowl on Feb. 2 at the MetLife Stadium in Meadowlands Sports Complex in Rutherford, NJ, located just to the west of New York City.

In this blog, I will take a look at the forecast outlook for the game, making it clear what is possible to say nearly two weeks out from the big event.  Since my blog is only read by Seahawks' fans, perhaps some of the information can be useful to the team and the 12th men/women that might attend.


Why is the weather important?  

Sure, really bad weather might cancel or delay the fun, but the real question folks want to know is which team will be favored by the weather.   There are all kinds of speculations in the media and online conversations:

(1)  Many suggest that rainy and windy weather would be a big advantage for the Seahawks, an "all weather" team comfortable with the elements in Seattle.  The Denver Broncos are used to far drier and sunnier weather.   It turns out the local meteorologist Nick Bond has done an analysis of the Seahawks win-loss records versus weather conditions, finding:
  • When it rains or snows during Seahawks home games, the team’s record during the past decade is 17-4, a winning percentage of 0.81. The average point differential is almost 12.
  • Without precipitation, the Seahawks record in home games is 42-25, a winning percentage of 0.63. The average point differential is about 5. 
 Rain and storms are no problem

 (2)  Cold is seen as an ally for Seattle, since Bronco's quarterback Peyton Manning is said to be cold sensitive.  As noted in an authoritative article by CBS News:

 When the temperature is 32 degrees or colder at kickoff, Peyton Manning's career record is 4-7. That's a 36.4 winning percentage. In all other games -- meaning, warmer games -- his winning percentage is 69.3 percent (174-77). 

 Reputably cold sensitive

So if the temperature is below 32F or if rain/snow is in the air, expect weather to advantage the Seahawks.  Good weather, meteorology should not be a factor.

Can we forecast the weather for Superbowl Sunday a week or more ahead?

Although weather forecasting technology has improved dramatically over the past few decades, forecast skill--the ability to predict specific weather features-- fades in time.   At longer forecast leads, generally greater than 7-8 days out, one is usually better using climatology.

So as any good forecaster does, lets start with the climatology (or historical average conditions) for Feb. 2  from nearby Newark, New Jersey:

Average high temperature is 40F
Average low temperature is 25F
The probability of getting at least .01 inch of rain over the day is 35%.

But we can do much better than that. 

The game starts at 6:30 PM.  The New Jersey State Climatologist Office has computed the relevant statistics during game time.  Start with temperature at kick off:

 Averaged over roughly 80 years, the kick off (6:30 PM) temperature averaged 34F.   But it is clear there has been warming over the past century, so perhaps 36F would be better, eyeballing the chart above..   However, this is for Newark and the stadium is in the Meadowlands, which is is usually a few degrees cooler than the highly developed Newark Airport area, so let's stick with 34F.   So the expected temperature would be very close to the levels that would start giving Peyton Manning trouble.  It is also highly probable that this will be the coldest kick-off in Super Bowl history:  the current record is the 39-degree kickoff temperature at Super Bowl VI in 1972 in New Orleans’  Tulane Stadium.

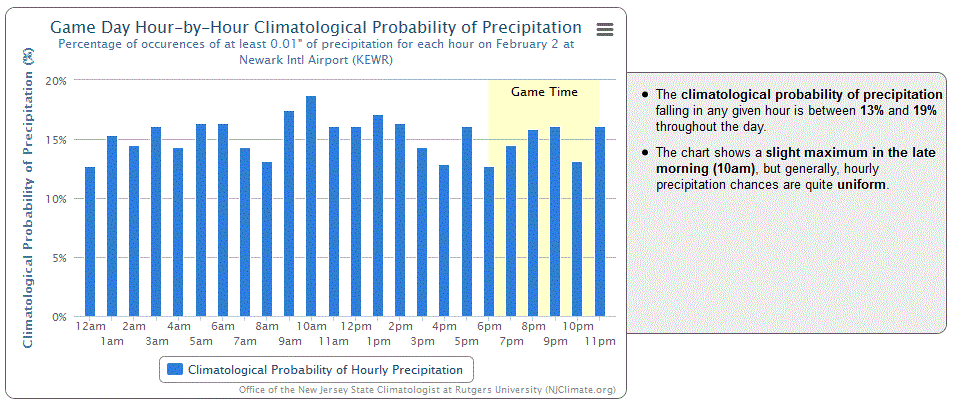
Precipitation during the game?  Any particular hour has about a 15% chance of precipitation.


This is a good start.

But let's get back to the issue of forecasting.  The National Weather Service and some other operational forecasting agencies (like the European Center for Medium Range Forecasts, the Canadian Meteorological Center, the UKMET office) run their models out several weeks and current runs are now getting out to Super Bowl Sunday.  But as I noted above, on average forecast skill degrades in time and generally offers no skill over climatology after aboiut a week.   The top figure below shows how forecast skill for sea level pressure of major weather forecasting modeling systems declines with time up to 10 days (1 is a perfect forecast, GFS is the U.S. model).  Once you get to around .7, climatology is as good as the model forecasts--about 168 hours out (7 days).
So you can't trust the detailed forecasts in general out more than about 7 days.  But sometimes there is skill extending out beyond 7 days (like with Superstorm Sandy) and there is a tool for determining when such days exists:  ensemble forecasts.  But more on that later.

First, let me show you the forecast for 7 PM on Super Bowl Sunday that you can't trust because they are out roughly 10 days, forecasts made by the National Weather Service GFS model.  High pressure over the game site and no precipitation.  Temperatures would probably be a bit colder than normal under such conditions.


But can we trust this solution?  As noted above, a major weather prediction technology uses many forecasts valid at the same time:  ensemble prediction.    Each forecast starts slightly differently or makes slightly different physical assumptions.   If the forecasts stay together at the longer ranges, forecast confidence is higher.  Also the average of the ensembles tends to be more reliable than a single forecast.

(Paul Allen connection: several of us have submitted a proposal to Paul Allen's foundation to use this technology to greatly enhance regional climate modeling, using an ensemble of climate models.  And then we would use the large scale ensemble to predict regional details under climate change.  A really promising technology with lots of good science.)

Here is the output of an ensemble made up of U.S. and Canadian global models (called NAEFS, the North American Ensemble Forecasting System) for 7 PM on Super Bowl Sunday.  The solid lines are ensemble mean temperature (degrees C) and shaded areas tell you how uncertain the forecasts are (actually the variability of the various forecast model simulations).  Temperature around freezing (0C), and moderate uncertainty.


What about precipitation?  Here is the output from the ensemble system (solid lines are precipitation (in mm) and shading is uncertainty. Light precipitation at most.


Finally, take a look at the  ensemble predictions for one nearby point: New York City.  The median (most probable) value is the black horizontal line.  The yellow boxes tell you the range for half the ensembles around the median. The brackets show you the extremes of the various ensemble members. You notice there is less uncertainty (the ensembles are all on the same page) for the short term forecasts.

This ensemble output suggest that it isi probable that the temperatures will be warmer than currently (they are very cold now), but there is a lot of uncertainty. Precipitation should be light, but a few ensemble members are fairly wet.   Winds are modest.


So what is the bottom line of all this?  If you were a Seahawks strategist, you should expect upper 20s to low 30s and a lack of heavy precipitation.  You also have to keep your eyes on the forecasts because there is considerable uncertainty ten days out.  Forecasts will lock in as we get 2-3 days from the big game.  The Seahawks will probably not have the heavy precipitation advantage, but the temperatures have a good chance of being cold enough to give Peyton Manning some problems.

And with the above revelations the bookies will stop pestering me....

The kind of 12th Man that we could use on Feb. 2.  He brings his own storms.


Tuesday, January 21, 2014

Winds Hit 115 mph in the Columbia Gorge

The strongest winds in several years struck the scenic Crown Point overlook above  the Columbia Gorge:  a gust of 115 mph.  The proof, provided to me by Portland TV meteorologist Mark Nelson, is shown below.   In fact, I have receive an unofficial report that the wind at Crown point reached 118 mph.


Just to orient you, here is a picture of Crown Point and a map of its location.


Crown Point has a lot of things going for it to get strong winds.   It is on the western side of the Gorge, so that winds can accelerate down this narrow gap if there is a large pressure different down the gap, with higher pressure to the east, lower pressure to the west.  This happened yesterday as shown by a forecast for 4 AM Monday by the UW WRF model.  The solid lines are isobars (lines of constant pressure) and the shading is temperature.  A lot of isobars down the Gorge and cold air on the eastern side (this will be important).

Yesterday the pressure difference across the Gorge (Troutdale-The Dalles) got to 10 millibars....this is a lot.   But there is something else that juiced up this event:  the shallow cold air.  As shown in the figure above, cold dense air in eastern Washington was pushing up against the Cascades and then accelerating within the narrow, near-sea level gap. 

Aircraft landing at Portland (just west of the gap) documented this cold shallow flow.   Here is the proof:  a plot of winds and temperatures above the airport in time.  (time increases to the left, heights in pressure--850 is about 5000ft).   The easterly winds are very shallow (below about 925 hPa/mb, roughly 2500 ft, time in UTC:  20/18 is 10 AM Monday). There is a super inversion  above the cold air, particularly in the morning (20/12 is 4 AM on Monday).

Why is the having cold, shallow air important for getting strong winds? 

In the narrow Gorge the cold air is relatively deep, but when it gets to the western "exit" the walls fall away and the cold air collapses.   This creates a very intense local pressure difference since the cold air is dense and heavy.   Where it is deep, the pressure is high.  Where it is shallow, the pressure is less.  So a big change in height of the cold air, produces a strong temperature gradient.   The stronger the inversion above the cold air, the bigger the effect.  Here is a schematic of this process:
 As shown by the max winds for the 24h period ending 9 AM today (Tuesday), the strongest winds (these are gusts in mph) were at the exit of the Gorge where the cold air collapse was occurring.


It takes super-high horizontal resolution in a forecast model to simulate such effects. No problem!  The UW high-resolution (4/3 km grid spacing) model is up to the job.  Here is a 36 h forecast of the sustained wind speeds valid 4 AM on Monday.  The model got it right...


 One more thing.  Winds at Crown Point are also enhanced by the fact it is on a tall bluff, since winds are locally accelerated by such objects.  Just to be fair....