As I look outside this morning, white cottonwood seeds are floating and drifting up and down-- roughly a month earlier. I love these floating tuffs: you can see the atmospheric eddies that are normally invisible.
Portland Airport (PDX) has their warmest April on record (going back to 1940). Essentially May temperatures in April.
Although we had a break last week (see my previous blog), this has been an extraordinarily warm spring and it is highly probable that this warmth will continue for the next few months.
Let's start by looking at the difference of surface temperature from normal for the past month (the temperature anomaly) from the Western Region Climate Center. The Northwest is a huge hot spot, with temperatures 6F above normal over much of Oregon, Washington, and Idaho. This is a very big warm anomaly.
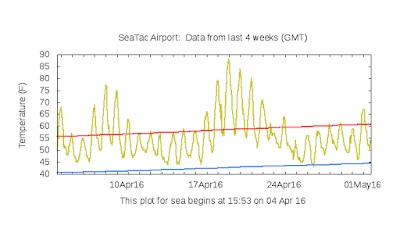
This warmth has not been from a constant heat wave, but periods of normality interrupted by very warm intervals. Seattle's temperature for the past week below illustrate this. As we will show below, the warmest periods are associated with anomalous high pressure aloft, with one major warm period (April 18-23) being the real culprit.
There was good reason to expect a generally warm spring. Although weakening, an El Nino is still present, with associated warm water along our coast (yellow/orange colors below) and low pressure offshore that produces enhanced southwesterly flow. The hated blob of warm sea surface temperatures over the NE Pacific has dissipated.
High pressure above the Northwest produces warmth is several ways. High pressure results in sinking air, which warms as it sinks (compressed). Such sinking reduces clouds, so we get more sun. On the western side of highs there is warm southerly flow. And the surface reflection of upper level high pressure (or ridging) is generally east of the Cascades, so we get more offshore (easterly flow), which produces more sinking (warming) over the western slopes of the Cascades and pushes cool marine air away from the lowlands.
The situation is not simply a general warming, as one might expect from anthropogenic global warming, but highly localized warm and cold anomalies driven by the enhanced wave pattern aloft.
The question you will be wondering: could this wave pattern be produced by anthropogenic global warming? At this point, the best answer is no. Research, including work done by my past Ph.D. student Matt Brewer, does not suggest this. In fact, global climate models run through 2100, suggest just the opposite: a deamplfication of the waves. But the persistence of ridging for a second year in spring is a bit unnerving.
It appears that natural variability is driving the waviness, but as always in science, we are not 100% sure.
But what about the rest of the spring? For the next two weeks, there is definite skill. The latest North American Ensemble Forecast System (NAEFS) guidance, based on combining the US and Canadian ensembles (running our models many times) suggests a warm Monday, followed by cool/wet period midweek, and warmer conditions next weekend (these box and whisker plots, with the yellow boxes showing the range of the 50% of the models closest to the median). The panel are temperature, precipitation, wind speed, and cloudiness.
The forecasts beyond 2 weeks are less reliable. But let me show you the prediction of the international seasonal ensemble (below): much warmer than normal for May and June. I suspect this will be correct.
So go ahead, plant those tomatoes. Put the seeds in the ground. If you are a gardener, reset your clock and think of today as June 1st and you will know what to do.
Go ahead, you can buy these for your garden or deck.


No comments:
Post a Comment