Wednesday, August 17, 2016

Glory and the Space Needle

Yesterday morning at the top of the Space Needle dawned sunny with low clouds on the horizon (see image), but around 7 AM low clouds pushed into Seattle, reaching the upper reaches of the Needle (shown below)

6 AM
 7AM
8:30 AM
 

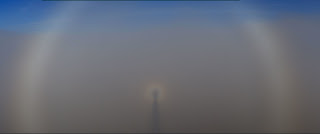
But something beautiful and subtle occurred as the low clouds extended toward the Space Needle:  a glory, characterized by colorful, concentric rings.  Here are a few shots from the SpaceNeedle cam: 


It is not rare to see glories when flying above clouds when the sun is high in the sky.


Glories are optical effects that occur when you have the right configuration of sun and clouds. They result when light is scattered back to the viewer by a field of relatively uniform, small cloud droplets and is always opposite the sun (centered at the anti-solar point), just as the shadow of an object (like the Space Needle or aircraft) would be.   It is possible to realistically simulate the generation of glories using the equations describing electromagnetic waves and their interactions with droplets (Mie Scattering) as shown below (the upper left corner is the simulation):


Keep your eye out for glories next time you are flying.


Monday, August 15, 2016

How to get aircraft turbulence information?

Some folks are a bit nervous about flying, with turbulence being a major concern.  They feel better knowing what will happen or is happening.  So where can you secure such information?

My favorite is from the NOAA/NWS Aviation Weather Center on their ADDS Turbulence website (www.aviationweather.gov/turbulence).  You can see an example below.  This page has turbulence SIGMETa (colored turbulence warming areas) in the upper left, pilot reports of turbulence (PIREPS) in the upper right, and model-driven turbulence forecasts at many levels and times (bottom panel).

The pilot reports are particularly useful and they are color-coded (green for light, orange for moderate, and red for severe).    Below is  a recent example for the Midwest.
 Turbulence symbols look like strange omega symbols--here is a blow up of how they look:


Light turbulence is routine--a modest movement that is not even uncomfortable, sort of like driving on a rough rode.  Moderate turbulence makes it a bit uncomfortable to walk around, but generally doesn't send things airborne (although the seat belt sign is virtually always on in moderate turbulence).  Finally, there is severe, which CAN send you airborne.

The final plot (on the bottom) provides forecasts of non-convective turbulence (from wind shear and mountain waves).  It is useful, but sometimes gets the pattern wrong.

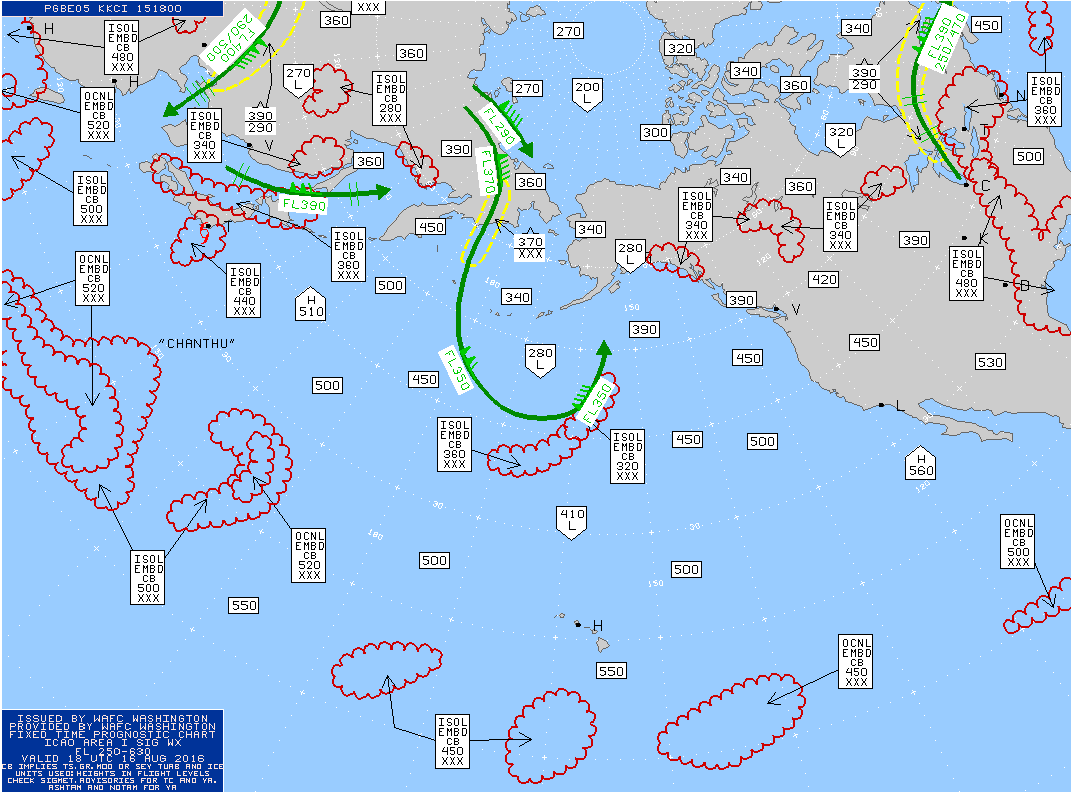
To check out turbulence on an international route, go to this  NOAA site: /www.aviationweather.gov/progchart.   An example over the Pacific (shown below) indicates turbulence with yellow dashed lines and thunderstorms by the scalloped red areas.   The Great Circle route to Japan looks clear, except for some thunderstorms over Japan.


Another source, and one particularly good for international routes, is turbulenceforecast.com.   They have some of the same things as the NOAA site, but they have other products as well.  You can even sign up for warnings.


You want some advice on lessening your exposure to turbulence?  Fly early in the day, because thunderstorms are generally less frequent then.   Don't sit in the back of the plane, which tends to be bumpier.  Avoid switching planes in Denver (a notoriously bumpy place to land any time of the year).  And fly as big an aircraft as possible.   But most important of all is to lock your seatbelt at all times.   Not all turbulence is forewarned. And having your head go through the ceiling is unpleasant.

Announcements:

New Weather Smartphone App, uWx

At the UW, we have developed a wonderful FREE weather app for Android smartphones that also collects pressure for use in weather forecasting. If you want to try it, please go to the Google PlayStore and download it.

Talk in Port Angeles on Wed. August 17th 

I will be talking in Port Angeles about the Future of the Pacific Northwest Under Global Warming at 6:30 PM on August 17th. More information here.

Saturday, August 13, 2016

Was the JetBlue Turbulence Incident Avoidable?

On Thursday night, JetBlue flight 429 hit severe turbulence over South Dakota, sending 24 passengers and crew to the hospital.  This turbulence, associated with a line of thunderstorms, resulted in the abrupt termination of the Boston to Sacramento flight, with an emergency landing in Rapid City, South Dakota.
This blog will analyze the meteorology of this event and examine whether it was possible to foresee and avoid this terrifying incident. (Answer:  it was).  Strangely enough, I was only a few miles from the incident, traveling on an Alaska Airlines flight between Baltimore and Seattle.

The Details

The actual flight path of JetBlue 429 is shown below with information from the FlightAware website. Weather radar information, but from a later time, is also shown.


A key problem for the JetBlue captain was to avoid the turbulence associated with convection (thunderstorm) over much of his/her route.

To analyze the situation we need to know the exact time and location of the incident.  FlightAware provides minute by minute information and I have selected (below) the period of interest before the aircraft was diverted (at 0716 PM Mountain Time or 0116 UTC UTC).  Looking the previous few minutes, you will notice they were flying at 33,400 ft and then dropped suddenly by 100 feet at 0714 PM.  I suspect that is the time of the incident.


Then they returned to their previous altitude.   The location at that time is provided and I plotted it on the map below.  The position is in south/central South Dakota.


Now we are ready to investigate the meteorology of the incident.  Let's start by looking at the radar imagery, based on the National Weather Service radars in the region (image from the NCAR RAP website).  Here is the radar reflectivity at 0115 UTC, with an oval showing the aircraft location.  Red indicates high reflectivity, which is associated with heavy rainfall, strong vertical velocity, and lots of turbulence.  You want to avoid reds if you are in an aircraft.

Clearly, you can see the problem:  the plane flew into a very active portion of the thunderstorm complex.   Notice the arching shape of the red colors:  this is indicative of a very vigorous system.   In short, the aircraft entered a line of very strong convection,  a region that all aircraft should avoid. Strong midwest thunderstorms frequently grow to 40,000 to 50,000 feet and turbulence can exist above them due to upward propagating waves.

Here is a blow up so you can see the situation more clearly.


So how did this line of thunderstorms develop in the previous hour?   Did the pilot have time to avoid them?  To answer this question, let's look at a series of radar images prior to the incident and I will indicate the location of the plane on the imagery.

At 0100 UTC, 13 minutes before the emergency, the aircraft was well upstream of the convective line, with plenty of time to move around it (see below).

Ten minutes before that (0050 UTC), the convective line was apparent, with over 20 minutes to find a path around it.

During the prior hour, the convective line was strengthening and moving to the NE, something that is evident by looking at a series of radar  images (found here).

Normally, pilots fly around major convective lines like this.  There was plenty of time to get around it, and an excellent flight path to the south of the line existed.  So why did the pilot fail to avoid this dangerous feature?

One possibility was that the pilot did not have access to the real-time radar imagery shown above.   Pilots can view their aircraft weather radar, but as described later, such radars have limitations.  The radar I showed you above is available in a number of forms on the internet and a wide variety of web sites.   As a passenger, you can view the radar imagery in real-time at your seat using a laptop/pad and onboard internet services (like Gogo).   In fact, that evening I was following the weather on my Alaska Airlines plane, a few hundred miles away (although Gogo was really poor on my aircraft).   Unfortunately, many airlines do not provide such real-time radar data (from the National Weather Service radar) to their pilots, and I assume this is true of JetBlue.   No pilot would knowingly fly into such a severe line of convection.


What about weather radars on aircraft?  They are helpful, but provide only a localized view of the precipitation situation and possess relatively small antennas that do not give high-resolution information.  This is certainly true of the radar on the Airbus 320 (shown below), which was the aircraft involved in this flight (see below).


I assume that the aircraft radar did show the strong line ahead of the aircraft during the final few minutes before the incident, yet the pilot decided to punch through.  A mistake.

My Flight

As noted earlier, I was on Alaska 761 that left at nearly the same time from Baltimore and followed a route roughly 200 miles to the north of JetBlue 429 over South Dakota (see below).  Our pilot skirted north of that convective feature, with light to occasionally moderate turbulence (seat belt sign was on for most of it).

The Bottom Line

For some reason, JetBlue 429 headed directly into a strong convective line.   It should not have done so.   Radar imagery clearly showed the threat and there was plenty of time to avoid it.   Pilots should have access to the same detailed radar imagery that folks in coach with laptops (like myself) can readily access.   They should also receive the training necessary to understand the impacts of various types of convection.   My own conversations with pilots suggest that many do not have sufficient meteorological knowledge and this should be addressed.  With proper use of weather radar and good pilot training, incidents like the JetBlue 429 one should be avoidable.

Destroyed toilet in JetBlue 429.  
You don't see this happening in Boeing aircraft


Addendum

One of the comments left this very relevant link (https://blog.foreflight.com/2015/08/14/oh-hail-cockpit-weather-delta-1889/)

The writer describes a very similar situation where a commercial jet (another A320!) plows right into developing convection that nearly took down the plane.
There is no excuse for the current lack of state-of-technology real-time weather information in the cockpit.  The public should demand it, as should pilots that are putting their lives on the line everyday.

Announcements:

New Weather Smartphone App, uWx

At the UW, we have developed a wonderful FREE weather app for Android smartphones that also collects pressure for use in weather forecasting. If you want to try it, please go to the Google PlayStore and download it.

Talk in Port Angeles on Wed. August 17th

I will be talking in Port Angeles about the Future of the Pacific Northwest Under Global Warming at 6:30 PM on August 17th. More information here.

Thursday, August 11, 2016

California Water Temperatures in the Northwest

Why travel to southern California when you can enjoy equally warm water temperatures?

Where should you head?   British Columbia's Strait of Georgia.


Let's start with a broad view of current eastern Pacific sea surface temperatures (SST).  Cool temperatures (blue) in the Gulf of Alaska and along the West Coast north of Santa Barbara.  Why?   Because summertime northerly winds result in upwelling of cool water below the surface.  You have to go south to Los Angeles before water temperatures rise into the the 60sF (green, 20C is 68F)
Zooming in closer, one sees the coastal upwelling and the warmer offshore.  But if you look even closer (in the NE corner) was will notice some warmer water (yellows and even oranges) in the Strait of Georgia, between Vancouver Island and the BC mainland.

Let's move ever closer.  Cold in the Strait of Juan de Fuca, but into the mid-60sF  within the central Strait of Georgia.   Warmer than Los Angeles!


So why is the Strait of Georgia so warm?  The topographic map  of the region (below) and the depth of waters of the Strait of Georgia  (also shown) give some hints.   The inner Strait of Georgia is isolated from the ocean and has weak tidal currents.  Furthermore, there are substantial areas where the water is shallow.


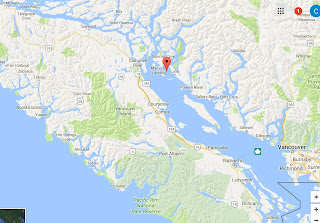
The result of reducing tidal action less movement of cool Pacific water into the Strait and less mixing of surface water, which can warm during the long summer days.   Such warming results in lighter water at the surface, which further reduces vertical mixing.   Thus, the water can warm into the upper 60s and occasionally into the lower 70s.  It is said that the warmest water north of Baja California is in Pendrell Sound, BC. (see map for location)


 Quite suitable for swimming without a wet suit!


Talk in Port Angeles on Wed. August 17th 

I will be talking in Port Angeles about the Future of the Pacific Northwest Under Global Warming at 6:30 PM on August 17th.  More information here.

Tuesday, August 9, 2016

Powerful New Tool for Smoke Forecasting

Summer is smoke season over the Pacific Northwest, and forecasters, air quality managers, and others have a powerful new tool for predicting the smoke distribution: NOAA/NWS's HRRR Smoke.

As I have discussed before,  HRRR stands for High Resolution Rapid Refresh, a NOAA/NWS numerical weather prediction system that produces high-resolution (3-km grid spacing) analyses and forecasts every hour.  This modeling system was a major advance for short-term prediction, also known as nowcasting.

More recently, HRRR-Smoke was developed, a modeling system that predicts the distribution of smoke over the U.S..   HRRR-Smoke makes use of the atmospheric chemistry capabilities of the WRF-Chem modeling system, and determines the  distribution of fires (and their intensity) based on satellite observations.   It then runs fire models that simulate the production of smoke that the wind field of HRRR smoke moves around.

Here is an example of HRRR-Smoke for the 24h forecast for 5 PM today.  Let's start with the national prediction--not much smoke over the Northwest, except for fires in eastern Oregon and Idaho.


 A regional image shows our area in more detail:


Currently, there are quite a few fires burning east of the Cascades, but most are not big smoke producers.  Because of moderate temperatures and normal precipitation,  fire activity in the Cascades and the Okanogan areas has been minimal (see map)


Yesterday's MODIS satellite imagery confirms that there is only limited smoke east of the Cascade crest.  Lots of low clouds over the west.


Future fires?   The latest model runs suggest a warming/drying trend over the region, with ridging (high pressure) over the eastern Pacific, as illustrated by the upper level (500 hPa) map for 11 PM Thursday.

Some areas of eastern Washington will surge to 100F or more--the latest forecast by weather.com for Yakima shows this:

Fortunately, there is little lightning expected this week, but some ongoing fires could surge as temperatures warm.

Saturday, August 6, 2016

Thunderstorms and Thunderboats

If a little thunder is good, more must be better?


Tomorrow in Seattle will be a day of thunder.  You start with the hydroplane races and the Blue Angels.    Lots of man made thunder.  But why stop there?   Some real thunderstorms may spice things up, as long as no one is hit by lightning, of course.


The latest forecast models suggest that showers and thunderstorm could well come in a few hours earlier than expected, with some approaching the region by 12-1 PM, with a significant chance (30-40%) by mid afternoon.

Here is the lighting guidance provided by the UW WRF for  11 AM-- potential for lightning over the coastal region.
 By 3 PM, the potential for lightning has spread through much of western Washington.
 The three hour precipitation precipitation ending 2 PM shows substantial showers in the north Olympics and SE of Seattle.
The next three hours  is similar, with central Puget Sound escaping the brunt of the action.  So perhaps the hydroplane races and Blue Angeles will not be seriously affected.


But watch the weather and your favorite radar weather app during the day to protect yourself from a sudden downpour.  And if lightning approaches, get off the water immediately and stay away from isolated tall objects.

Thursday, August 4, 2016

Seafair Weekend Forecast: A Lazy Low Visits

Few forecasts are more important in Seattle than the one for Seafair weekend, and this weekend will be a mixed bag.  If you need to pick one day for outdoor activity, Saturday should be the better day.


The issue is that our nemesis, an upper level trough of low pressure, will be approaching and greatly influence our region Sunday and Monday.   Here are a series of 500 hPa (about 18,000 ft) upper level maps.

Friday morning (at 5 AM)....a low to our northwest.


Saturday morning, it slowly easing southeastward.

 Sunday AM, this lazy low is slowly heading south.

 Finally, on Monday morning, this sleepy low has barely moved past us.


What a contrast to last year, when ridging (high pressure) was the rule.

With a low hanging around, temperatures will be 5-10F below norming (upper 60s).

Precipitation?   Nothing on Saturday and early Sunday before early afternoon will be dry.  Thus, the Seafair festivities will generally be fine.  But later in the afternoon, the combination of upward motion from the trough and surface heating will result in the formation of convective showers (including thunderstorms), as suggested by the forecast precipitation for the 3-hours ending 5 PM on Sunday.   The greatest threats will be over the coastal zone and NE Washington.


As the upper low moves by, the showers will rotate northward into western WA.   The 48-h totals ending 5 AM Tuesday are impressive along the coast and over southern BC and Alberta, with some areas getting more than an inch (pink and black colors).


The big worry?  lightning.   The models are suggesting lots of instability on Sunday and Monday and thunderstorms can be expected.   So there may be a lot of smoldering fires ready to rev up with warmth and wind next week.


Popular Posts