Friday, May 15, 2015

Seattle's Erratic Support of Bicycle Commuting

Today is Bicycle Friday, the day that Seattle's bicycle commuters celebrate and goodies of all kinds are found near local commuting routes.

But all this celebration does not cover up an important truth:  Seattle does not have a consistent and effective policy for making bicycle commuting an enjoyable and safe mode of transportation in the city.


The evidence of Seattle's halting, inconsistent, and sometimes wasteful policies are easy to demonstrate.   There are also been a few success stories that show what the city can do when it tries.

Fact Number 1:  Seattle is incapable of keeping its main bicycle superhighway, the Burke Gilman Trail, in decent condition.

Thousands of bicycle commuters use the trail every day. I blogged in depth about the sad state of the trail earlier, with heaving roots, cracks, holes, and broken edges.  After my and other complaints, Councilwoman Jean Godden (the only councilperson who seemed to care about the problem) and representatives of the Park's Dept. met with me on the trail.  They promised action.     Some work was done, but many of the worst sections have not been fixed (see pictures) and dangerous, slapdash plywood "repairs" on the 35th Ave bridge have not been taken care of.   When they do some repairs they are cursory and not permanent.  Repair work has now stopped completely.  What will it take to get the Parks Department to take Burke-Gilman trail maintenance seriously?


Fact Number 2:  There are no protected bicycle routes into the city from the North End.  Or the south end.

Many folks living north of the Ship Canal would like to commute into the city by bicycle. Amazingly, the city has not established a single route whereby a cyclist can commute without serious and dangerous contention with cars.  I have tried it several times....I am still shaking from the experiences.  If Seattle is serious about fostering bicycle commuting there MUST be protected bike routes.  It is as simple as that.

Fact Number 3:  The city has wasted large amount of money on feel-good, PR-rich schemes that have not helped the situation.

The first was the lame scheme to paint bicycle symbols (sharrows) on busy streets.  Somehow that supposed made the streets safe for cyclists.  Tens, if not hundreds of thousands, of dollars were wasted on this dangerous and ill-conceived scheme.  And many cyclists are hit by cars and opening car doors on sharrow-painted streets.

Really safe!  LOL

Perhaps the biggest waste of money on feel-good schemes is the Pronto bicycle rental stations placed around the city.   Millions of dollars were spent to acquire the bikes and the docking stations.  And Pronto reports the cost of the enterprise is about $110,000 a month.   I have seen only ONE Pronto bicycle being ridden around the UW or on the Burke Gilman trail.  The usage statistics show dismal popularity.  For example, in 2014, each bicycle was used for 1/2 a trip per day.  You read that right. ONE HALF a trip per day.  Want to use a Pronto bicycle for a day.  That will be $77.00!    Their whole pricing structure pushes short rides and discourages extended use by tourists or folks wanting a longer ride.  At some docking areas (e.g., Children's Hospital), there is almost no usage.   The Seattle media has not touched this disaster yet... perhaps Danny Westneat of the Times will take it on after he deals with the pesticide-spraying shellfish industry.


Lonely, but expensive bikes with no where to go

When will the political class take bicycle commuting seriously?

Imagine if the city created FOUR absolutely protected bike routes into and out of the city (form NW, NE, SW, and SE Seattle).

Imagine if the Burke-Gilman and other bike paths were properly maintained?

Perhaps it is time for city officials and councilmembers to stop taking PR opportunities for things they can't change (like kayaking around Shell Oil drilling platforms) and do something that will really help reduce carbon usage and greatly enhance the livability of the city (like dealing with the bicycle commuting problem).  There is so much talk in the city for living green and having a low-carbon footprint.  Yet, the city seems powerless to plan and execute a bold plan for making safe, effective bike commuting a reality.   Really sad.

There are some reasons for hope.  Some safe bicycling areas have been created downtown, like the second ave protected bike lane (see pic)


And near U. Village, some of the crossings of the Burke-Gilman Trail have been made much safer:


And some innovative new companies, like Rider Oasis, want to revolutionize bike maintenance and make bicycle-oriented products available 24-h a day.


We have waited long enough to see Seattle becoming a truly bicycle-friendly city.  The increasing traffic and density of the city calls for making bicycle commuting a viable alternative.  Does anyone have the vision and leadership to make this happen?  Kayaking around Shell Oil platforms and riding around Pronto bicycles might get a lot of press, but someone has to do the real work that will make a real difference.

_____________________________________
Announcement:  On June 3, I will be on the Seattle Channel's Civic Cocktail with Governor Inslee.  If you would like to be in the audience, you can get tickets at : http://www.seattlechannel.org/CivicCocktail.  They charge, but you get appetizers with their no-host bar.

Wednesday, May 13, 2015

Eastern Washington Gets Some Drought Relief

Next time you go to a local casino, you might want to take some farmers from the Roza Irrigation District in eastern Washington for good luck.  Those are the folks, with farms from roughly Yakima to the Tri-Cities (see map), that decided on May 11th to stop irrigating for several weeks in order to save water for later in the season.

Their gamble paid off, big time.   Today, substantial rain, associated with easterly flow circulating around a low pressure area east of the mountains, drenched the inland empire, with many locations enjoying 1-2 inches of steady rain this morning and early afternoon.  In contrast, the usually wetter western sides of the Cascades were far drier.   How could that be?

This rain was sufficient to thoroughly soak the ground and obviate the need for irrigation for a while, and even provided some water for the Yakima River reservoirs. The weather gods were clearly smiling on the eastern Washington agricultural community.

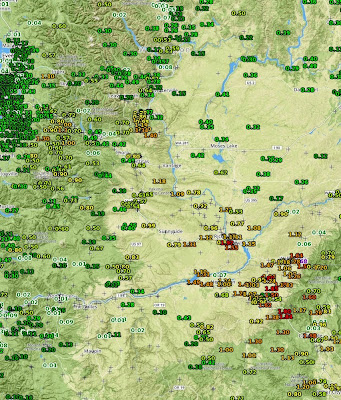
Let me show you some of the data.  Here is the 24h precipitation ending 5 PM from the National Weather Service observation site for eastern Washington (the reds and orange colors are the higher amounts, click on map to enlarge). Nearly two inches of rain fell northwest of the Blue Mountains around Walla Walla and similar amounts occurred over the Horse Heaven Hills above the Tri-Cities.   Much of the Roza district had over an inch, and substantial amounts fell over the eastern slopes of the Cascades.


The daily precipitation from the WSU Ag Weather network shows a similar situation (see map) with over two inches south of Benton City.   A dry wheat farmer from there called me today....he was a very happy fella.

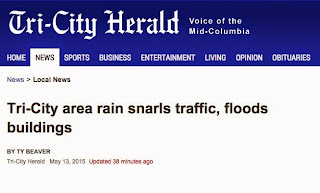
The rain was heavy enough that some roadways were flooded, as were some commercial districts (see article below).

This situation was relatively well forecast by the models several days ago (my past blog is proof!).

So why so much rain on the eastern side compared to the west of the Cascades?

The winds in the lower atmosphere over eastern Washington were from the east or northeast, not the normal westerly direction.  The cause? A small, but intense, low pressure system moved northward east of the Cascades today, as illustrated by a weather map for around 5000 ft valid at 5 AM this morning (see graphic).  This system had a band of moisture that circled the low center, a band that was directed over southeastern WA and NW Oregon.


An infrared satellite image at the same time and a radar depiction at 9 AM, illustrate this "wrap around" plume of moisture.


More good news for eastern Washington farmers: cooler than normal, occasionally showery, weather is ahead, although not like the torrents of today. And the aggressive storage of water for the Yakima project by the Bureau of Reclamation is still obvious (see plot).  Even pulling water for agriculture and fish during the last few weeks, the total reservoir levels (blue lines) are still above average for this time of the year.  Hopefully, the recent rains and conservation in the Roza district will cause the decline in reservoir level to slow during the next week.

I am a bit more optimistic than some regarding eastern WA agriculture this summer.   Our region is undergoing a snowpack drought, not a precipitation drought.  Reservoir managers have stored more water than usual.  And, how do I say this diplomatically?   Some farmers have wasted water, including spraying during mid-days when evaporation is huge.  As noted in a recent radio segment by NPR's Ana King, some farmers/orchard owners are switching to drip irrigation, saving as much as 50% of the water.  Improving irrigation technology will take a few years to put in place, but the long-term impacts on water use could be huge.

Monday, May 11, 2015

Drought Help

The atmosphere over our region has made a major transition and it appears that the next week or two will be much cloudier and wetter than we have seen in a long time.  The ridge is gone, replaced by deep troughing over the eastern Pacific.

Importantly, the new circulation will bring substantial precipitation to eastern Washington and the eastern Cascade slopes, regions that desperately need the precipitation.

The UW WRF model precipitation for the next 72 hour shows some substantial totals for May, ranging up to  1-3 inches in the Cascades, particularly over the north Oregon terrain.  Eastern Washington is quite wet, as is the Willamette Valley.


Precipitation continues for the next 72 hr, again with LOTS of rain over and east of the Cascades.

A substantial proportion of this precipitation will be from thunderstorms.  In fact, there was a large collection of thunderstorms over eastern Oregon today.

So why the big shift?  Take a look at the upper level (500 hPa) forecast map at 5 PM today (Monday).  An upper trough over Oregon!

 4 PM Tuesday, same general idea.

4 PM Thursday, the trough deepens and extends southward over California.  Folks, this is NOT a dry pattern for the West Coast...and not a warm one either.


Interestingly, the atmosphere seems to be locked in such a configuration for a while.  Not the kind of weather tomato plants like.

Want to really be impressed?--- here is the total precipitation over the western U.S. for the next 16 days (from a relatively low resolution model, the GFS.  Four to 10 inches in some locations.  This has to make Northwest farmers and water managers smile.


Tuesday AM Update: The radar at 5 AM shows bands of moderate precipitation circling around the trough, with particularly heavy rain (yellow colors) over SW Washington and NE Oregon.  This precipitation should move northward today, with moderate precipitation along the eastern slopes of the south-central Cascades.


Saturday, May 9, 2015

Pacific Jet Stream Terror Weapon: Fu-Go Fire Balloons

We often think of the powerful Pacific jet stream as a conveyor of Pacific storms in to the Pacific Northwest, but during World War II it was used for a different purpose:  as the transport mechanism of terror weapons, Japanese balloons that dropped incendiary devices on the western US.

During late 1944 and early 1945 over 9,000 of these terror balloons, known as Fu-Go, were launched by Japan, with the goal of starting massive forest fires over the western U.S..  Only about 300 were documented to reach western North America and they proved to be ineffective weapons.   Regrettably, six people lost their lives when they happened upon  and explored an unexploded Fu-Go.


There are several books about these fire balloons, one I just finished reading: Fu-go: The Curious History of Japan's Balloon Bomb Attack on America by Ross Coen.   Interestingly, this story begins with Japanese meteorological studies during the 1920s.

During the 1920s, a Japanese meteorologist, Wasaburo Oishi, began probing atmospheric structure from a site near Mount Fuji by launching a series of weather balloons called pibals (pilot balloons).    By tracking these balloons with a small telescope and doing some simple trigonometry, it is possible to determine the wind speed variation with height (assuming the balloons move with the surrounding air).
Wasaburo Oishi, often considered the discoverer of the jet stream,

Wasaburo quickly found something of great interest during 1923 and 1924:  during the winter the winds often increase with height, with winds of great speed located 25,000 to 35,000 feet above sea level, something that later became known as the jet stream (see a figure from his famous 1926 paper).


His 1926 paper did not get a lot of attention because it was written in Esperanto, but today many people give him credit as the discoverer of the jet stream, the current of westerly strong winds (reaching 150-250 mph at placea) in the upper troposphere and lower stratosphere.  The Pacific jet stream is known as the strongest in the Northern Hemisphere and is often located over Japan.  To illustrate, here is the average upper tropospheric winds (300 hPa, around 30,000 ft) for Dec-Feb 1981-2010.  The winds are in meters per second.  Roughly double for knots or mph.  South/central Japan is jet stream heaven;  Ooishi had a big advantage!

During the 1930s, German meteorologists documented the jet stream over Europe (much weaker) and during WWII the jet stream had a huge impact on aircraft operations, sometimes causing westbound aircraft to lose virtually all their ground speed.

As World War II went increasingly against the Japanese, their military decided to try a last-ditch effort to terrorize the U.S. and to force the Americans to divert their resources to fighting fires:  the Fu-Go fire balloons.   The work of Ooishi and other Japanese meteorologists delineated the existence of the jet stream and the military believed that weaponized balloons could reach the U.S. in 3-5 days.

The fire-balloons were made of paper, 30 feet in diameter, and had an ingenious ballast mechanism (with dropping sand bags!) to keep the balloons at altitude.   At the end of its flight, each balloon could drop a collection of incendiary bombs (see image)

Sand bags and fires bombs hand from the lower portion of the Fu-Go fire balloons.

Although most of the balloons crashed in the Pacific, hundreds made it to Alaska and the western U.S. (see map), some getting as far as Iowa.  Quite a few landed in the Pacific Northwest, but none were effective in starting fires.

Landing sites of Fu-Go balloons

The Japanese had meteorology against them:   the jet stream is strong during winter (November through March) when the western U.S. is not vulnerable to fires.  During the summer, when our forests and rangeland are dry, the jet stream is too weak to serve as reliable cross-Pacific transportation.

As I have noted in previous blogs, although fire balloons are not coming from Asia anymore, smoke, dust, and other pollutants are frequent, unwelcome, hitchhikers on the strong Pacific jet stream winds.

Thursday, May 7, 2015

Summer 2015: The Northwest's Global Warming Stress Test

By the end of the summer, we will know whether the Pacific Northwest is ready to deal with global warming.   And if not, what we need to do to prepare.  A virtual climate stress test.

As I have noted in a previous blog, our winter and spring have brought weather conditions that are stunningly close to those expected to be normal by the end of the century.

In short, this winter we were much warmer than normal, with near normal precipitation and far below normal snowpack.

For example, during our core winter months, temperature over our region was roughly 2-6F warmer than normal, and over the past year we were 2-4F above normal.
In contrast, our precipitation over the water year (since October 1) has been near normal (yellow/green colors, see graphic)

And our snowpack has been abysmal, with the Washington Cascades currently at around 20% of normal, the Olympics at 1% of normal, and only the mountains of NE Washington as high as 50%.

According to regional climate simulations run at the University of Washington and the analyses of the UW Climate Impacts Group, these conditions are close to what is expected around 2070.

So the central question is:   is our society ready for 2070 conditions, today in 2015?

We are about to experience a climate change stress test.  How will we manage?

With so little snowpack, will there be enough water for personal use and agriculture?
Will there be major destructive wildfires?
Will salmon and other wildlife be hurt by low summer streamflow?

By the end of the summer we will know....

The latest model forecasts suggest we not only start with 2070 spring conditions, but this summer will be warmer than normal.  For example, the latest NOAA Climate Forecast System model forecasts for June-July-August are for surface air temperatures of 1-2 C (2-4 F) above normal.
Adaptation measures

Our local, state, and Federal officials are pulling out the stops to prepare us for 2070 conditions.  As I mentioned in an earlier blog, Seattle Public Utility managers very wisely brought the levels of the Tolt and Chester Morse reservoirs way, way UP during the winter rains, thus making up for the lost snowpack in late spring and early summer (the red line is this year's reservoir storage, green is last year, and blue is average).  Even without much snowpack, the city has enough water to get through the summer.  That is resilience.


The biggest water fears are in the Yakima Basin, where there is insufficient storage to get through an entire summer without snow melt.   But there ,the U.S. Bureau of Reclamation did something daring: they decided early in the winter not to worry about potential flood risk and begin filling the reservoirs much earlier than ever before.   A week ago, they essentially had them all at 100%, something never done this early in the season.  

The graphic below shows the total storage of the 5 major Yakima reservoirs (blue line) compared to last year (green) and an average year (red).   They topped off the reservoirs near the max MONTHS before normal.  Daring and smart.  There will still be water shortages on the Yakima, but nothing compared to what would have happened if the Bureau of Reclamation didn't act so proactively.

The Columbia River flows will be low, but not near any records because the snowpack in BC was much higher and the Columbia drains off of colder, higher elevations there.

Governor Inslee's drought declaration should enable some farmers to tap well water and to purchase water from those with senior rights.  More help for adaptation to the 2070 climate.

Will there be excessive wildfires?  My colleagues in the U.S. Forest Service are not sure.  True, warm weather help dry surface "fuels", but will there be much lightning, an important initiator of many of our conflagrations?  Might the high pressure that has brought the warmth and low snowpack decrease the lightning frequency, reducing fires?

Although it may not be politically correct to say this, might  we find that 2070 weather has some positives?  Like a longer hiking season?  Less bugs in the mountains? More pleasant temperatures though most of the year?  Lower winter heating bills?  Less seasonal affective disorder?  Less avalanche injuries?   Forget I said it.

In short, we will soon learn whether our region, taking some aggressive steps to deal with the unusual snowpack and temperatures, is ready to take on the climate of 2070.    Scary perhaps, but a fascinating experiment.    And if we do have major problems, we will have insights into what we need to fix before 2070 is upon us and particularly our children and grandchildren.

Tuesday, May 5, 2015

FINALLY! Some cold, unstable air over the Northwest

During a normal spring we get plenty of cool days with showers, the kind of weather that plagues parents watching their kids play sports and keeps our ground moist until the summer period of dehydration.  But not this year, with our persistent high pressure and sun.

But today was different and I was glad:  yesterday I put new grass seed into my lawn and placed a few new plants in the garden.  And days like today are very helpful for dealing with our current snow drought, since it reduces our need for water and helps fill our reservoirs.

Some light snow hit Paradise on Mt. Rainier yesterday (5500ft)-picture at 8 AM Wed.

The origin of the change was a strong upper level trough over the Pacific Northwest (see image of the 500 hPa (roughly 18,000 ft) map with the solid lines showing the height of that pressure surface above sea level).  A nice trough over us and a ridge over the eastern Pacific.


Such an upper level trough is associated with cool air aloft and upward motion.  That produces clouds and precipitation.   The air is relatively unstable with cold, dense air aloft over warm air near the surface (the sun is fairly strong now).   Such an unstable vertical profile produces convection (thunderstorms and towering cumulus), which we saw today.  In fact, it was unstable enough to produce a half-dozen lightning strikes around western Washington.

Here is the visible satellite image at 2 PM this afternoon....lots of convective clouds.  You can notice particular substantial clouds over central Puget Sound (a Puget Sound convergence zone was going on).   Note how the cloud coverage is enhanced over land--that is due to solar heating at the surface.


As the convergence zone interacted with the mountains, substantial precipitation fell over the terrain.  Earlier today, when the convergence zone was directed to the NE, heavy precipitation fell in the Cascades to  the northeast of Bellingham--as much as 2.5 inches during the 24 h ending 9 PM Tuesday.  As the winds on the coast rotated to a more northwesterly direction, the convergence zone precipitation reached the central Cascades.


To illustrate this change in configuration of the convergence zone precipitation, here are two radar images:  one around 9 AM and the other around 4 PM.  Big difference in the orientation of the heavy precipitation (yellow and red colors)


Don't get too comfortable with the cold and showers.  High pressure will build this week, bringing steadily improving conditions.  Low 60s on Wednesday, rising to upper 70s on Saturday.  I guess I will have to water my new grass seed...

Sunday, May 3, 2015

Seattle's Lightning Detection Network Illustrates Volcano Lightning and Much More

Did you know that perhaps the premier global lightning detection network is centered her in Seattle?
And that it not only can sense lightning from thunderstorms but the discharges produced by major volcanic eruptions?

An amazing technological achievement, based at the University of Washington, is called WWLLN (World Wide Lightning Location Network, website here).   Led by Professor Robert Holzworth of the Earth and Space Sciences Department of the UW College of the Environment, this network is based on a collection of sensors that receive the electromagnetic pulses emitted by lighting.

But before I talk about this system, lets discuss about volcanoes and lightning.  A few weeks ago, the Calbuco volcano erupted in Chile, producing a huge ash cloud and associated lightning.  Volcanoes can produce lightning because the turbulent ash clouds can result in charge separation, in which there are large differences in electrostatic charges in the clouds.   Such charge differences result in lightning.


The intense lightning pulses associated with the volcano-produced electromagnetic signals are picked up by the WWLLN network, which measured over 1000 lightning events over a few day period (see graphics below).


Most major eruptions produce lightning, including our local favorite: Mt. St Helens.

But back to WWLLN.  This network encompasses roughly 50 sensors around the world (see map, large red asterisks show the current sensor sites).


These sensors measure electromagnetic emission in the Very Low Frequency (VLF) band (3-30 kHz).  When a lightning event occurs there is a pulse of electromagnetic radiation (much of it in this band) that is called a "sferic."  When I was kid I used to listen to a lot of AM radio and I noticed I could tell when thunderstorms where approaching by the increasing static--which was produced by the radio waves propagating out from local thunderstorms.   Same general idea.

As the electromagnetic pulse propagates away from a lightning event (either cloud to ground, cloud to cloud, or cloud to clear skies), it is picked up by multiple WWLLN sensors.  Since we know how fast radio waves travel (speed of light), by getting the time of arrival of the lightning pulse at multiple sensors (WWLLN demands at least 5), the location of the lightning pulse can be determined. Anywhere in the world.  Pretty neat.

Here is the WWLLN lighting totals for 30 minutes ending 11:15 AM Sunday (plus the infrared weather satellite imagery).  Lots of lighting over the SW U.S.


Or how about the average lightning over the world on Friday?  No problem. (see below)
Lots of lightning in the tropics, which is not unexpected.

But what I really love is their real-time interface in which you can watch in real time as lightning strikes around the world.  You can view it here or click on image.


Lightning detection networks, like WWLLN, are powerful tools for meteorologists.  It helps us warn folks of approaching lightning.   We can use the information to understand the climatology of lightning and the physical processes inside of storms.  Some of us are using lightning to improve weather forecasting by using lightning information to better initialize our numerical forecasting models.

In fact, I have had a project to do this with graduate student Ken Dixon, Robert Holzworth, and Greg Hakim.  Here is an example of a forecast  of  what a weather radar would see without (left, control) and with (right, nudge) the use of lightning for a major convective event that hit the U.S. east coast on June 29, 2012 (2100 UTC, 5 PM EDT).  Big difference.


As shown by the observed radar (below), using lightning data from WWLLN really improved the forecast.