Friday, July 15, 2016

Is the Blob Really Dead?

There is a fixation on vampires and the like in the popular media and it appears that this trend has now hit coverage of meteorology.   Some are now claiming that our region's meteorological warm-blooded nemesis, The BLOB, has returned from the dead.


Worse than that...it has been hiding beneath the surface of the Pacific.  Now this a bit personal to me, since I had called it dead in a previous blog, suggesting that the silver stake had passed through the heart of that torrid villain.

Just as a reminder, the BLOB is the invention of the Washington State Climatologist, Nick Bond, whose sense of humor is both endearing and quirky at the same time.  This feature is associated with a region of much warmer than normal surface water over the eastern Pacific and has had a major impact on fish and other critters in the ocean.  Research has shown that the BLOB was the result of unusually persistent high pressure over the eastern Pacific.

Back in early 2014, the BLOB was terrifying in its strength, with sea surface temperatures (SST) more than 2C (about 4 F) above normal (the figure  belowshows SST anomalies...differences from normal..for Feb-March 2014)

Even last summer, the BLOB was still in good form and even stronger than before, with warm anomalies approach 4C.  You will also note warm water along the equator associated with El Nino.


But just as a vampire deflates when it loses its blood supply, the BLOB has been weakened by the loss of its parent:  high pressure over the eastern Pacific.  Take a look at the SST anomaly for earlier this month.  If the BLOB is not dead, it is on life support--a shadow of its past self.  And the El Nino warmth along the equator is gone, with a ribbon of cool water instead.

Now some folks are suggesting that the BLOB is actually hiding under the waves, but that doesn't seem quite right, since the definition of the BLOB was based on surface conditions.  With El Nino gone and La Nina in the offering, there is little chance of the BLOB returning.  Trust me.

Of course, some folks can never be convinced...


Wednesday, July 13, 2016

To Become World Class, US Operational Numerical Weather Prediction Needs a Strategic Plan

Before beginning a long, arduous journey, you first need to know exactly where you are going.

With only a vague sense of direction, you will waste a lot of time and effort, taking backroads, instead of superhighways.  Going the long way, rather than using short cuts.
You won't get anywhere fast.

And so it is with the National Weather Service and the US operational numerical weather prediction.

This blog will show that a key reason why the National Weather Service has fallen behind in numerical weather prediction is because it has no long-term plan for where it is going and no strategy for excellence.  And until it starts developing clear cut, long-term goals and implementation plans in concert with the US weather community, it will remain behind.  A national tragedy, and an unnecessary one.

A Long Journey

Numerical weather prediction is one of the most difficult tasks undertaken by our species.  It requires observations from space, in the atmosphere, at the surface, and below ground.  The use of complex numerical models and the most powerful supercomputers.  The knowledge of phenomena that range from the atomic to the planetary scale.  It requires coordination of hundreds or thousands of scientists, computer specialists, and members of the public and private sectors, as well as effective interactions between the operational and academic communities.   Only with clear goals and coherent planning can a national effort in numerical weather prediction be state-of-the-art.


The Situation at the National Weather Service:  No Long-Term Strategic Plan for Numerical Weather Prediction

Numerical weather prediction (NWP), the bedrock of all weather forecasting in the U.S., is done at the Environmental Modeling Center (EMC) of the National Centers for Environmental Prediction (NCEP), which in turn is part of the National Weather Service and NOAA.

And now the shocker.  EMC, which is responsible for US global, national, and regional numerical weather prediction,  has NO strategic plan.  None.  No long-term direction of where it is going.  No detailed implementation plans.  Nada.

Don't believe me?  Check out their website--you won't find one.  I have talked to EMC leadership and they confirmed that there is no long term plan.  But they are thinking about putting one together. Sometime, perhaps.

We can go one level up in the National Weather Service to NCEP.  They do have a strategic plan.  But that plan is general and wide-ranging with little detail on where US numerical weather prediction should be going.   Just a few sentences.  Some examples:

  • Eliminate 3 significant bottle necks in the model implementation process. 
  • Implement a robust, multi-day convection-allowing ensemble system for US high resolution impact based decision support.

Good ideas, but not much meat on that bird.  No timelines, no definition of who does what, and exactly what is hoped to be achieved.

But surely the National Weather Service as a whole has a strategic plan.  They do.   But this plan is full of gauzy generalities with few specifics. It calls for a Weather Ready Nation.  No much that is actionable.  Little on numerical weather prediction.

The Competition and World Leaders

In contrast to the plan-shy National Weather Service, their competitors DO have specific and comprehensive strategic plans.  Take the European Center for Medium Range Weather Forecasting (ECMWF).   As noted in my previous blogs and by many others, ECMWF is not only the world leader in global weather prediction, they are accelerating away from the National Weather Service in terms of forecast quality and resolution.

ECMWF has developed and followed a series of strategic plans, such as the one they just completed for 2016-2025. Among other things, their plan calls for a 5-km (grid spacing) resolution global ensemble by 2025.   Sufficient resolution to start to get convection right without parameterization.   Just amazing.  And with hard work and planning they will do it. (For comparison, the current, smaller, NWS ensemble has a grid spacing of roughly 35 km)


But ECMWF planning does not stop there.  They have detailed four-year implementation plans as well.  Plans with a lot of detail.   Thus, it is no accident that ECMWF produces the world's best numerical weather forecasts.  They develop coherent, scientifically viable long-term strategies and work efficiently to make them happen. They integrate the best science into their efforts.  Such long-term vision and planning is completely missing at the National Weather Service.

The Next Generation Global Model and the Lack of Strategic Planning

A great example of the impact of the absence of NWS strategic planning in numerical weather prediction is currently playing out.  After Hurricane Sandy made evident to the nation that US numerical weather prediction had fallen behind, Congress and the administration pumped considerable funds into NOAA and the National Weather Service. The National Weather Service was able to upgrade its computers from 1/10th of the resources of the European Center to parity (which is very good). They also began work on a new global modeling system to replace the aged GFS (Global Forecast System).   This new effort is called NGGPS (The Next Generational Global Prediction System) and had the goal of developing a state-of-the-art global prediction system that would bring the US at least to parity with those pesky Europeans.

Unfortunately, the NWS had no long-term strategic plan for a modeling system that would be in place for next 10-15 years.   While the Europeans have a clear vision of moving to convection-allowing global resolution within a decade, the National Weather Service had no such long-range view.  As a result, the testing and planning for the new system was NOT directed towards securing a system that would best serve the nation in ten years or more.  Rather, the competition between potential new global models was decided based on using the resolution of today (13-km) and the physics (e.g., moist physics) of 20 years ago.    It appears that this myopic, short-viewed approach will select a modeling system (GFDL's FV-3) that is inferior to the other choice (NCAR's MPAS) at the critical high resolution of the future.   The European's will be chuckling:  they are now working on a new model that from what I can tell is very similar to MPAS.


But the core dynamical model is only one aspect of a mature numerical weather prediction system, with physics and data assimilation being equally as important, if not more so.  But there is no long-term plan on how the National Weather Service will integrate state-of-science physics and assimilation to their new model.

But that is not all

 The lack of strategic planning has left National Weather Service modeling ineffective and inefficient.  They are too many modeling systems.  Too many legacy runs.  Too many legacy products.

 For example, there are two larger-scale ensemble systems (GEFS and SREF) over the US.   Two major modeling high resolution systems run over the US (WRF ARW and NMMB).  While other major weather prediction efforts have moved to a unified model approach (same model for all scales), the National Weather Service has no real plans to move in that direction.  And while NWS modeling efforts are dissipated on a needlessly complex array of models and runs, they are not attending to critical US needs, like running a large, convection-allowing (4 km or less) ensemble over the US. And perhaps most embarrassing of all, the new operational computer, capable of propelling the US forward rapidly in numerical weather prediction, is only being lightly used.

Strategic Planning Requires Community Input and Consensus

The experiences of the past several decades provide compelling evidence that without long-term strategic planning the National Weather Service's numerical weather prediction will lag the rest of the world.   But for strategic planning to be effective, the vision and plan must be a good one, and there is only one way to ensure the quality of the plan:  to involve the larger research and operational community in producing a consensus plan.  Strategic and implementation plans can not be the product of an individual within the NOAA bureaucracy or even a collection of NOAA folks.  It must include the academic community, the private sector, NOAA/NASA and other government folks, and individuals from NCAR (National Center for Atmospheric Research).

An excellent organizer for the creation of such a consensus planning effort might be UCAR's (University Corporation for Atmosphere Research) Developmental Testbed Center (DTC), which already has a close working relationship with the National Weather Service.   With sufficient support, they could also provide the central organization of a coordinated US numerical weather prediction effort.
Epilogue

The National Weather Service (NWS) Environmental Modeling Center  and NOAA in general have many excellent scientists and software engineers.  I know a large number of them personally.  Many are frustrated that they are spending time on models that have no real future.  That they are often isolated from their colleagues in research.  The key problem today for NWS numerical weather prediction is one of leadership and organization, and first and foremost, the US operational numerical weather prediction effort requires a comprehensive strategic plan and implementation strategy.  Not for 1 or 2 years, but for the next decade and beyond.   I know of several examples of extraordinarily talented young scientists, folks that could help move US operational NWP into leadership, that are turning away from careers in the NOAA or the NWS because they don't see a future there.   That must change.  And a community-consensus strategic plan for the next decade would be a good start.


Monday, July 11, 2016

Frost in July Hits the Pacific Northwest

Seems a little chilly for mid-July?    Amazingly, a number of locations east of the Cascade crest have experienced FROST during the last few days, stretching from Washington into northern California.  Here is the proof, a plot showing the low temperatures of 36F or below last night.  A few locations got down to 25F!


A number of the upper air locations around the region experienced record, or near record, cold temperatures in the lower atmosphere last night.  Here is an example of the temperature at 925 hPa (about 3000 ft) at Spokane, WA.  The silver dot is the observed temperature and the blue line is the daily records low....pretty much the same!
Particularly cold temperatures (down to 25F) were found east of Crater Lake, at locations such as Kirk, Oregon (4500 ft).   This map shows last night's temperatures in that region.


And here is the temperature plot at Kirk, Oregon.

Why so cold there?  The station is in a high valley, so cold air drains down from higher elevations.  The air was unusually cold aloft and skies were clear (thus, good radiational cooling to space).

And for snow lovers, good news!  Parts of the Rockies picked up snow during the last few days.  Here are the snow analysis for July 1st and today.  You will notice some new light snow over northeast Oregon, central Idaho and western Montana.


Saturday, July 9, 2016

Stunning Cloud Photos and Falling Ice Crystals

During the past several days I have enjoyed a wonderful treat, as folks around western Washington have sent me some spectacular cloud photos.   And as I will talk about later, many have a common element: ice crystals falling out of upper-level clouds.  But first, lets take a look at a few.

Kirsten Owens of Bainbridge Island sent this one.

 Another taken by Mike Doherty near Green Lake


One from KPLU head, Joey Cohn, looking west from West Seattle.


And Chris Hyde of Olympia sent this one, which he described as a "freak cloud"


All of these pictures share wispy streaks of clouds that curve and twist.   In fact, these are ice crystals falling out of mid and upper level clouds.    Such features are often called fall streaks or mares tails, and get curved and distorted because wind varies in the vertical (wind shear).   Sometimes they are also called virga, particularly if they evaporate before reaching the ground.

Your perspective makes a big difference.  In the last picture, the fall streaks look horizontal because the view point was under the cloud.

Let's go back to the curved structure of many fall streaks, such as the one shown below.  The horizontal winds in the atmosphere vary with height.   Generally, winds are stronger aloft (often highest at jet stream level---25,000-35,000 ft).  So precipitation generated at higher tropospheric levels near the jet stream falls into slower air, tends to slow down, thus producing a curved structure,


But there is another subtlety.  As the ice crystals fall, they tend to evaporate and become progressively lighter.  The fall velocity of the ice particle is dependent on the weight of the particle and thus the descent of the ice particle progressively slows.   With less vertical motion, horizontal motion dominates, causing the ice particle to predominantly move horizontally.  The schematic below illustrates this:


But whatever the physical origins, the beauty of falling ice crystals, illuminated by the colored light of sunset or sunrise, can be spectacular, moving, and possessing an ethereal quality of subtle beauty.


Thursday, July 7, 2016

Januly

OK--it won't be quite as bad as January, but compared to our expectations for this period, it will feel like it.    And the weather maps are reminiscent of mid-winter.


Is it REALLY July 7th?

Let me "warm up" by showing you the infrared satellite image this morning. Clouds extend from the Northwest to far out over the Pacific.


The precipitation maps for the next 6 days would discourage anyone thinking about outdoor fun.  The next three days precipitation total has rain over the entire region. with North Cascades getting particular attention.

The subsequent three days has light rain west of the Cascades crest, but very large amounts over western Montana and eastern Idaho.


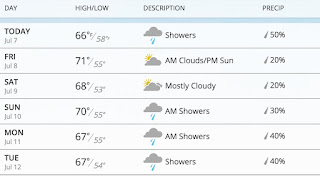
The latest weather.com forecast for Seattle has clouds, showers, and temperatures in the upper 60s 


The forecasts for the mountains?   You don't want to know about that.

This cool/wet/cloudy weather is associated with persistent low pressure (troughing) over the region.  

 Now you really want to see something amazing?   Here is the upper level (500 hPa) map (showing heights and temperature) for 5 PM Saturday.   Stunning.   Deep low off the WA/OR border with the jet stream (where the lines are close together) pushing southward into northern CA.


The temperatures at this level will approach daily low records at local radiosonde stations (Quillayute, WA and Salem, OR).   

Any snow with this pattern?  Of course!  Here is the snowfall for the 24h ending 5 PM Monday.   Parts of Idaho, Grand Tetons, and Yellowstone will get snow.   That will surprise some visitors!


This pattern of troughing/low pressure over the Northwest has been persistent for weeks and the latest Climate Prediction Center 8-14 day forecast continues the cool (see map)

These is a good chance this will end up one of the coolest Julys in years for the Northwest.  And remember:  climatologicaly the driest/warmest period of the entire year is only three weeks away!


Tuesday, July 5, 2016

Two Places to Enjoy Fresh Summer Snow: Greenland and the Pacific Northwest

Some of us really miss snow in July and it is such a pain to travel to Greenland to experience it.

But don't worry, because of an usually cool weather pattern, you can enjoy snow within a day's car drive, without going to Greenland.

Don't believe me?    Here are National Weather Service precipitation type forecasts from their GFS model.  Blue is snow, rain is green.  First, the forecast for next Sunday morning at 5 AM.   Amply snow in Greenland, but also over the higher elevations in the Northwest.


Six hours later, snow in Idaho!


The origin of this wacky summer weather?   An amazing triple low over western North America and the eastern Pacific, as illustrated by the upper level chart at 11 PM Saturday.   The trifecta of cool.


The long range models have been having a very hard time forecasting the persistent cold trough (low pressure) over the Northwest.  Here is the 4 week forecast centered on July 10th (the date of the above figure).    Yellow or red are above normal heights or pressures.  Didn't have a clue.

The long-term forecasts have consistently missed this persistent western U.S. troughing  (low pressure) and cold.  So I would not put away your sweaters and be prepared for snow at higher elevations in the mountains.

You don't have to go to Greenland to experience snow this week.  Just head to the North Cascades.


Monday, July 4, 2016

July 4th Weather and the Coolest Early Summer in Years

Looking at the model forecasts for the next week, I was taken aback--it was more reminiscent of middle spring than early summer, with much below normal temperatures and lots of showers.  This is a VERY different situation than last year and the persistent low pressure over the coast is not going anywhere fast.

First, today's weather.   The 8:20 AM radar shows a few showers over Northwest Washington and along the western slopes of the Cascades.  Scattered light showers elsewhere.

 The visible satellite image at 8 AM shows extensive low clouds over the eastern Pacific and western Washington and Oregon.  Classic situation with cool marine air enveloping the region west of the Cascade crest.

The latest forecasts suggest a cool day, with extensive cloudiness breaking up into partly cloudy skies away from terrain.  Here is the UW WRF model precipitation forecast for the three hours ending 11 PM tonight (fireworks time).  A few scattered sprinkles, particularly on the Cascade western slopes.

The weather.com forecast for fireworks time (see below) suggests temperature around 60F with about 15-20% chance of precipitation.   Bring a sweater.

But marginal July 4ths are a tradition in western WA, and usually this is a rapid improvement in the following week.

Not this year.

Here is the forecast upper level chart (500 hPa) for next Saturday morning.  A HUGE low pressure centered east of Vancouver Island.  The jet stream (where the lines are close together) is strong and heading south into Oregon and northern CA. What season is this?

The latest Climate Prediction Center 6-10 day forecast for temperature and precipitation is enough for you to put away the shorts and pull out the sweaters.   Blue cold in the west, while the eastern US is warming

Precipitation?  Wetter than normal over us.

The forecast precipitation for the next 72h is moist enough, with British Columbia, the Rockies, and the northern Cascades getting significant rain.  It is good that Washington State held off from promulgating a drought declination.   And the threat of major wildfires is obviously hugely reduced by this situation.


But the next 72h is amazing, with several inches in the Cascades.


The new normal has switched to the old normal.

Popular Posts